Per the EPA, “The term ‘heat island’ describes built up areas that are hotter than nearby rural areas.”

The EPA has established a Heat Island Reduction Program (HIRP) and expressed that it is useful for communities in the preparation of projects, programs, and policies. While this language is nurturing vice systemizing, the statement is contained in a section titled “What EPA is Doing to Reduce Heat Islands.” An intent is obvious, and it must be considered that EPA is not a hobbyist organization.

The Fourth National Climate Assessment (NCA4, 2018) is more generally focused but certainly does encompass the Heat Island philosophy. There is no escaping that NCA4 is intended to influence statutory, common, and administrative law as well as academic and sociopolitical underpinnings.

As the macro climate change philosophy continues its adoptive trajectory the micro aspects will gain traction. In fact, it is the micrometeorologic and microclimatologic assays that will be most potent in the types of diagnostic programs EPA is fostering, particularly in enforcement initiatives.

Thermogram of a Botanic Garden on an Approximately 110°F Day in July, 2018.
Thermogram of a Botanic Garden on an Approximately 115°F Day in July, 2018.
The Same Thermogram with False Color (Dark Blue) Indicating Features with Apparent Temperatures of 160°F or Higher.
Daytime Aerial Thermogram of a College Campus with Synthetic Turf at an Apparent Temperature Exceeding 170°F. Ground Ambient Temperature Approximated 105°F.
Night Aerial Thermogram of a Hospital Complex with False Color (Dark Blue) Indicating an Reflected Apparent Temperature Exceeding the Approximate Ambient Temperature (20°F).
Night Aerial Thermogram of a Hospital Complex with False Color (Dark Blue) Indicating an Apparent Temperature Exceeding the Approximate Ambient Temperature (20°F).

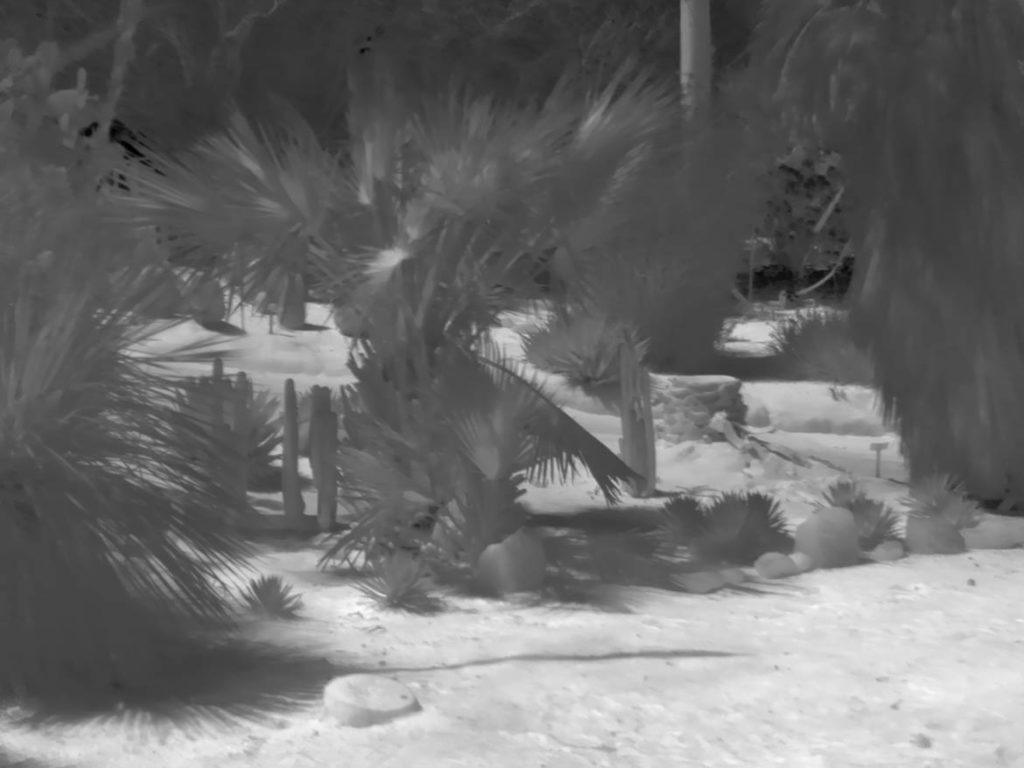
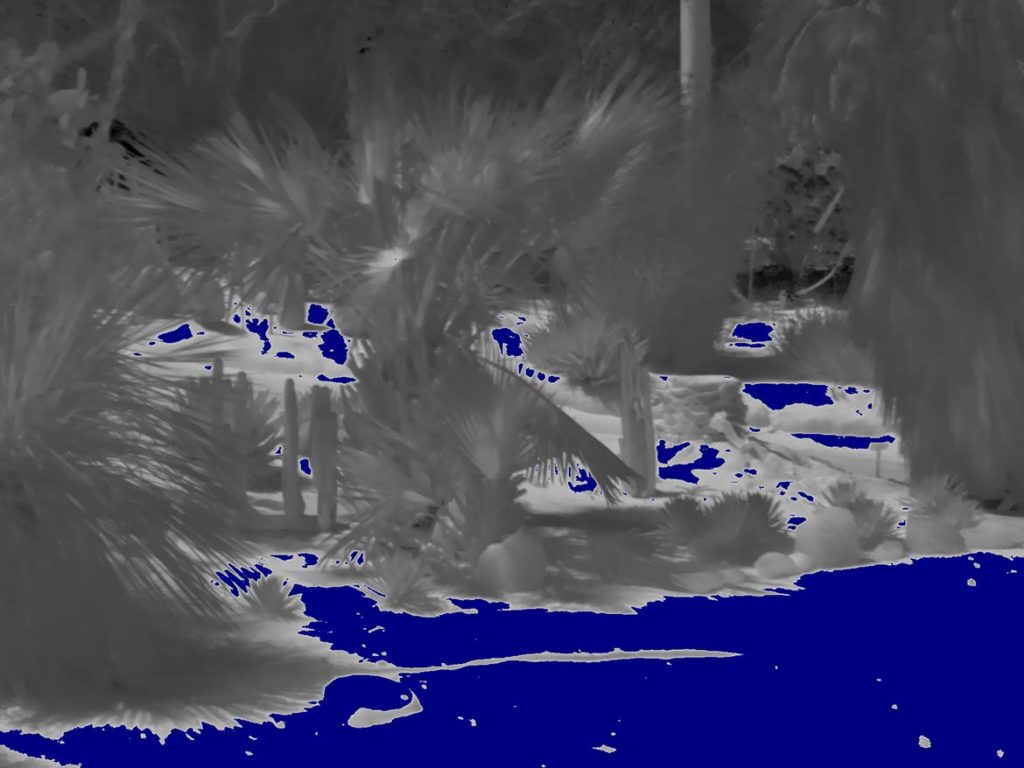
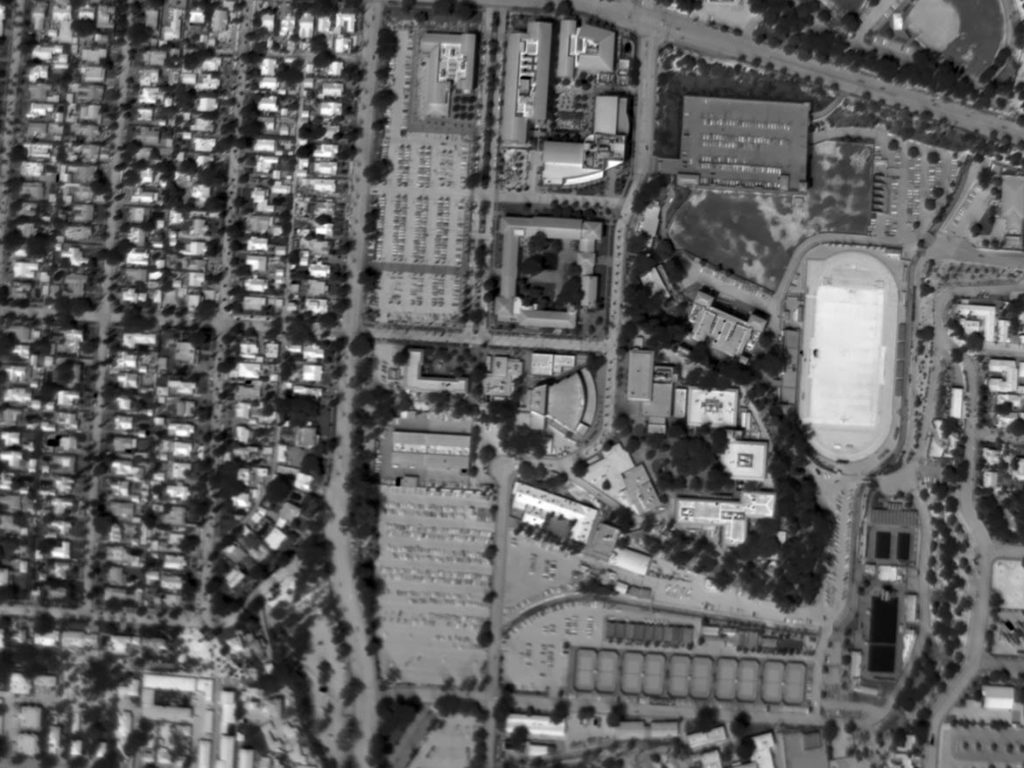
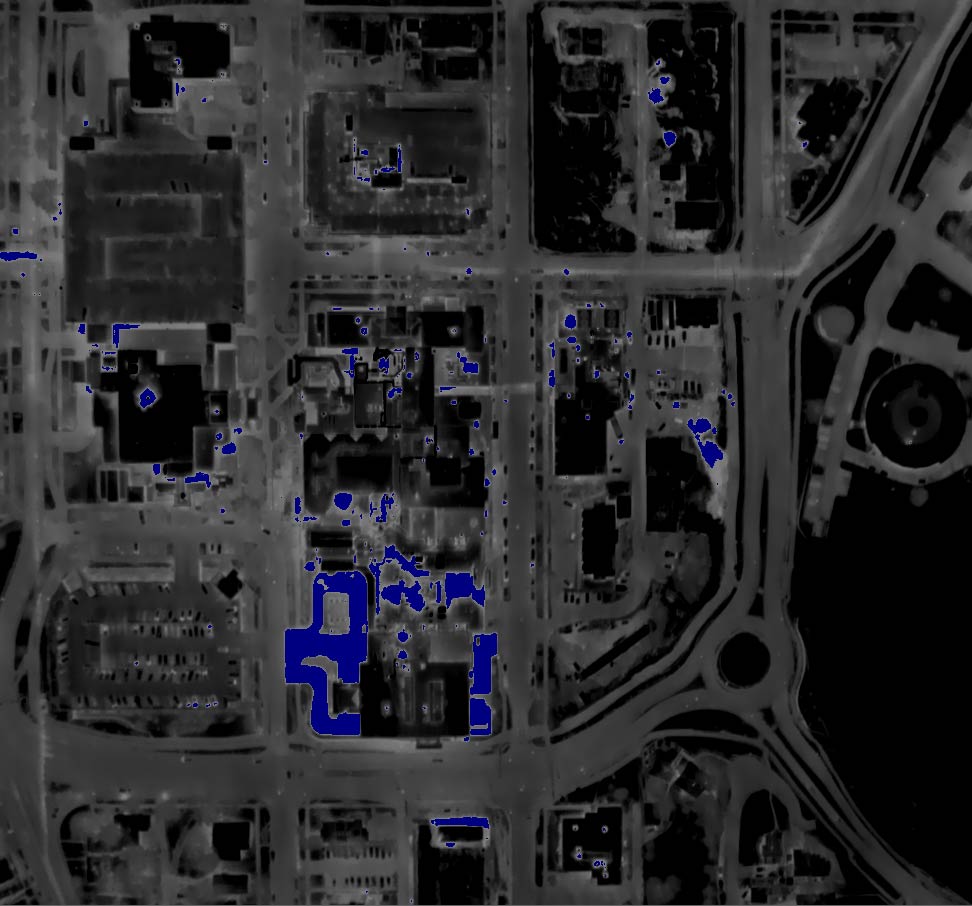
The preceding examples are agonizingly elementary and do not necessarily indicate thermal pathologies.1 They do illustrate latent thermal features in micro contexts and rudimentary practices to visualize them.

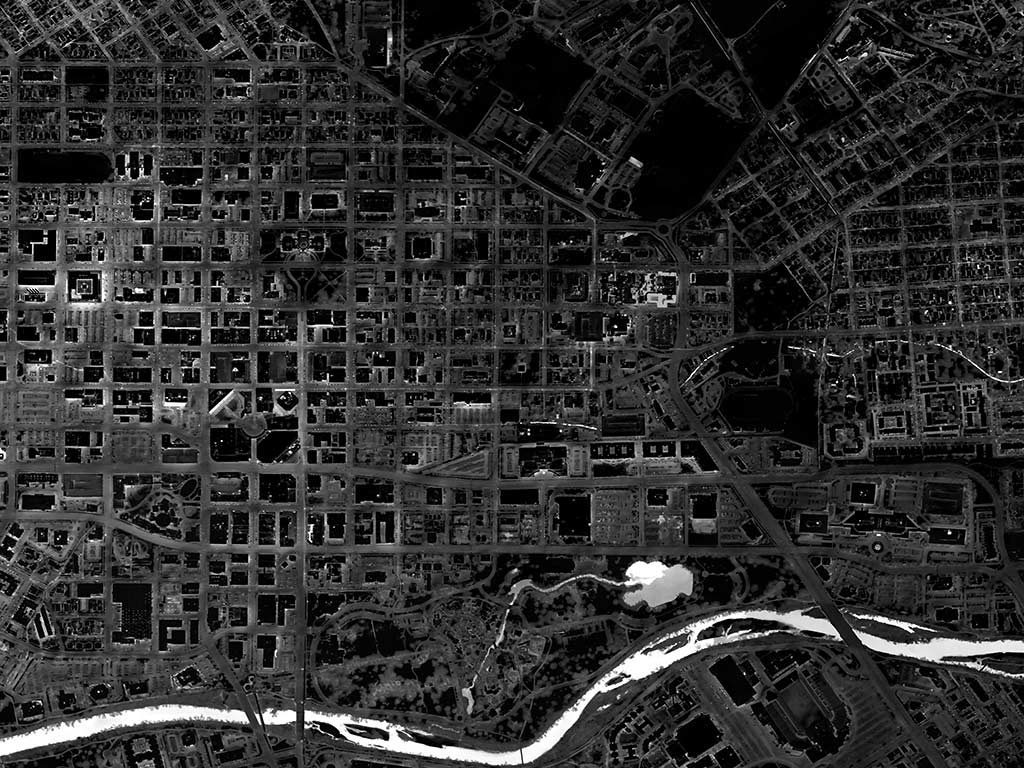
6-12″ Ground Sample Distances (GSD’s) have been empirically proven sufficient for common urban structural thermal analysis, though tighter samples are more defensible in some quantitative exercises and with respect to Nyquist Rates and IMFOV.

Oblique data sets-and areas of substantial axial displacements in orthographs-suffer profoundly variable emissivity and reflectivity (ε and ρ) and can be tedious and knotty to analyze. This tends to compel high altitude (e.g. 2,000AGL), “long lens” (e.g. 28HFOV) collections that are not possible with common sUAS (“drones”).

Superfluous spatial data can be logistically and tactically hostile; it is crucial that ambient conditions (temperature, convective events, insolation, etc.) are as static as possible during discretely timed collections, and sometimes as close as is possible to a comparative assay.

Applying thermographic data to LiDAR is expected to be a dominant practice in critical assays; the advantages of thermal patterning-including temporal thermal patterning-in three dimensions can be very descriptive of interests relating to current interpretations of EPA’s narrative.

Small Section of Urban and Suburban Thermal Map of Boise, Idaho, 12/18. Thermal Contributions to Context Are Obvious in the Urban Core.

L


  1. For example, there is no reason to challenge the use of heated inclined driveways for ambulance access to emergency rooms in snowy/icy environments.
Author

Expertise: Defensible extreme-specification forensic and research LiDAR (LASER Scanning) and thermographics, near-infrared & visible band imagery (photography, videography, time lapse, macro- and microphotography & video). Environmental controversies including water temperatures, geotechnics, and erosion volumetrics, architectural illumination. Construction, engineering, and craning operations and incidents. Color management, color science, and human visual acuity relevant to litigation. Certified Level II (Advanced) and Level III (Master, Managerial) Thermographer; FLIR Infrared Training Center. Certified Terrestrial LiDAR operator; theory, planning, and data interpretation; FARO Technologies, GmbH. Certified Aerial Photographer (Professional Aerial Photographers Association, International). Certified Master Aerial Photographer (Professional Aerial Photographers Association, International: one of ~50 to ever receive the award as of 7/18). OSHA 30 Certified (General Industry). Adobe Certified Expert: Photoshop (CS4, CS5, CS6, CC). Adobe Certified Expert: Premiere Pro (CS6, CC). Adobe Certified Expert: Flash Professional (CS5, CS6, CC). Adobe Certified Expert: Web Specialist (CS6). Adobe Certified Expert: Video Specialist (CS6, CC; 1 of 105 in the world as of 7/18). (Inactive) Member, Professional Advisory Board, Stevens-Henager College. (Inactive) Moderator for Adobe's online Photoshop, Premiere, & Flash forums. (Inactive) Lecturer, Law Seminars International.

1 Comment

Write A Comment