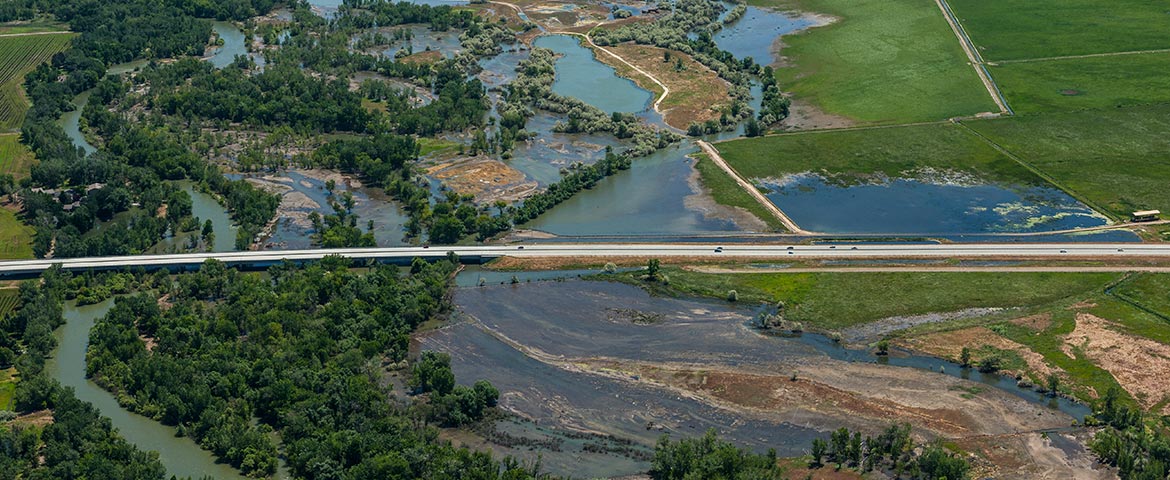
The baseline and responsive documentation-and immediate dissemination-of technical (aerial, hyperspectral, etc.) imagery of flooding is tremendously practical.
(more…)Tag: Mapping
-
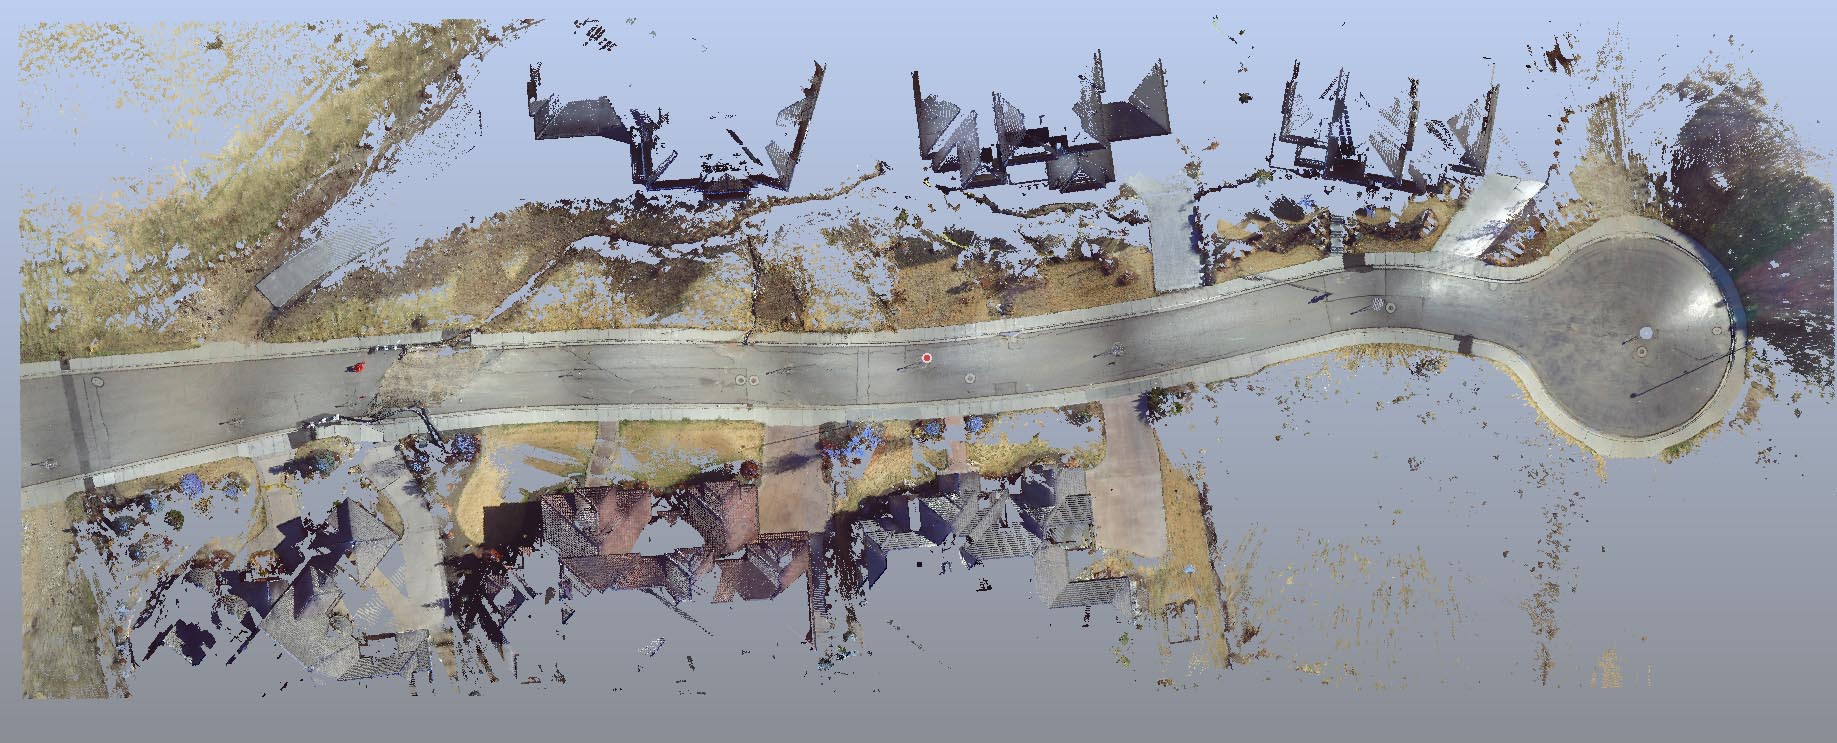
Forensic LiDAR: Neighborhoods in Motion
Forensic LiDAR and “engineering grade” or “survey grade” LiDAR (LASER Scanning) are very different things. Applications in which engineering and survey LiDAR conventions are manifestly deficient include litigation and its ADR cousins.
(more…) -
Mapping Assets for General Distribution: Blaine County May 2017 Flooding Aerial Photography Index
Mapping metrologic data assets is frequently necessary, particularly with hyperspectral (other than visible band, e.g. thermography) imagery and spatial data sets such as LiDAR; the images simply aren’t accessible or recognizable by the general population using ordinary software.
Please see our 3/5/19 post on similar data in the Treasure Valley (Boise, Meridian, Star, Middleton, Nampa, Caldwell…).
Localization and accessibility become critically important in various forensic, demonstrative, and contentious environmental affairs.
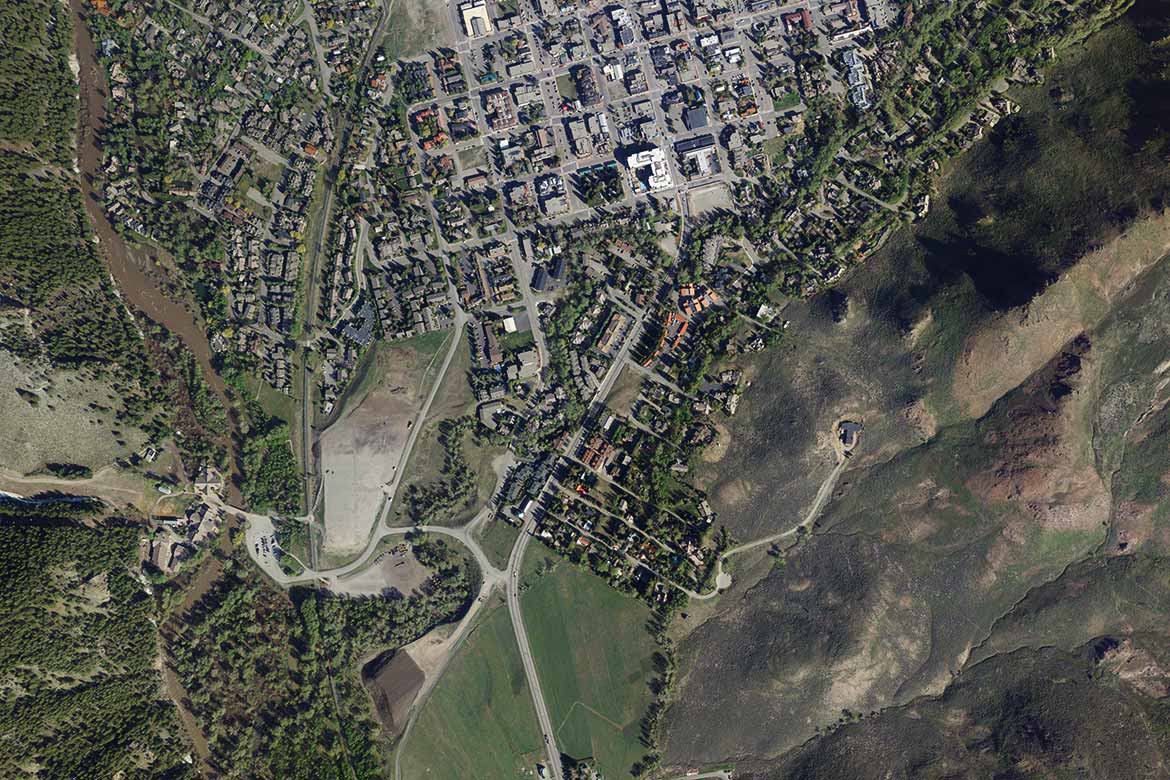
When it is necessary to distribute assets to varied populations using a ubiquitous and intuitively navigable interface, Idaho Airships, Inc. prefers mapping combining infrastructure and geology such as terrain and rivers.
This concept is not limited to large areas such as that in the map below; we’ve mapped complex infrastructure, factories, and even brick elevations (walls) in similar fashion, with robust search, survey, and measurement functionalities. Navigation on microlocations doesn’t usually involve mountains and rivers, of course-we base some localizations on a Cartesian system.
We’ve made hundreds of similar data collections using aerial and terrestrial photography, videography, and thermography.
Navigate (within the map below) to your area of interest; clicking on a marker will open an “info box,” while right-clicking on the image in the info box will produce a menu allowing the download of the image whose center point is represented by that marker.
Hovering over the info box then clicking on the “More details” link will display the higher resolution image in a browser tab.L
